Note (May 2018): I should probably re-collect, re-analyze and re-write this to reflect what I learned about the ANT+ power meter protocol and through programming for ConnectIQ. Looking at the data now, the agreement between instant and average power of the P1 seems to indicate that it simply had zero drops – whereas the others had much more. Wished the WASP would record drop rate … or I might add that to my CIQ datafields.
One issue I see with power meters – when you go beyond just using it for day-to-day training and start to compare the data with that from other power meters or over a longer time period – is that although most manufacturers give some number about the accuracy of their devices, usually in the 2-3% range, they really give you just that single number.
Given that it is difficult to engineer – sorry, I won’t explain this deeper at this moment – a power meter that is accurate at very low power, at very high power, for quick changes, and over a long time period, that single number is not at all useful. Neither for comparing different power meters when shopping nor as a guideline about how much you can trust your data.
I will write at some other time about other accuracy issues; in this post I will briefly compare Pioneer’s second generation (crank-based), Garmin’s Vector2 and PowerTap’s P1 (both pedal-based) about how they respond to changes in power, or, in other words, their delay time from measurement to output. Although I do have a background in engineering and science, these are just simple tests of single devices bought through common sales channels, so I don’t claim that this data is in any way representative: It’s just what I got when I rode some time. (Note: Unluckily I am lacking a hub-based power meter, which would really be nice to have for such a comparison. I still need to check how useful the power data from the KICKR are: I know that their power data isn’t that accurate as I’d like but they could still be helpful if their sampling rate is high enough.)
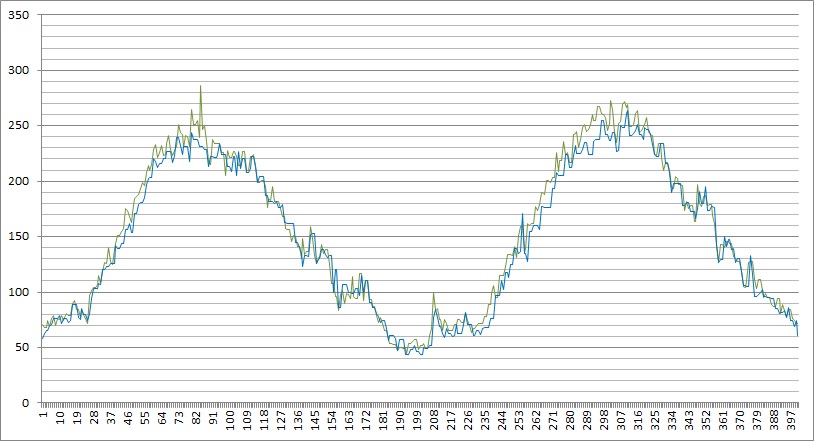
First up, Pioneer in ANT+ mode versus Vector2, recorded using North Pole Engineering’s WASP unit (note: this allows me to record synchronized at a 1 sec resolution without relying on any specific head unit) on a KICKR (note: I used TrainerRoad to design a ride including constant sections at different power levels, ramp-up and downs, as well as 15 sec spurts at different power levels. The KICKR was controlled from TrainerRoad with PowerMeter feedback from the Pioneer in automatic mode). These are one-to-one comparisons, so there is no way to know which if any of them is right. In most cases, both have delays and both data have some error.
When looking at the whole ride, the power numbers seem to match more or less: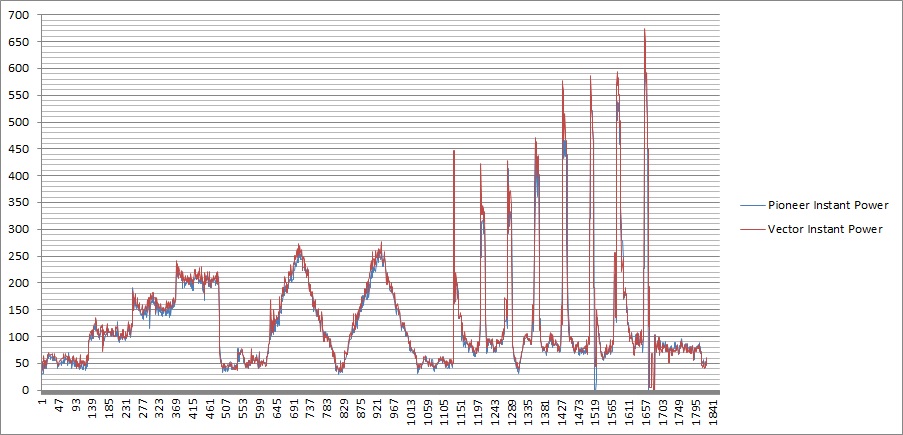 If one starts looking at the details, it seems that the Pioneer is slower to respond to ramp ups than the Vector2. Interestingly, this hold only for the up-ramp and not for the down side:
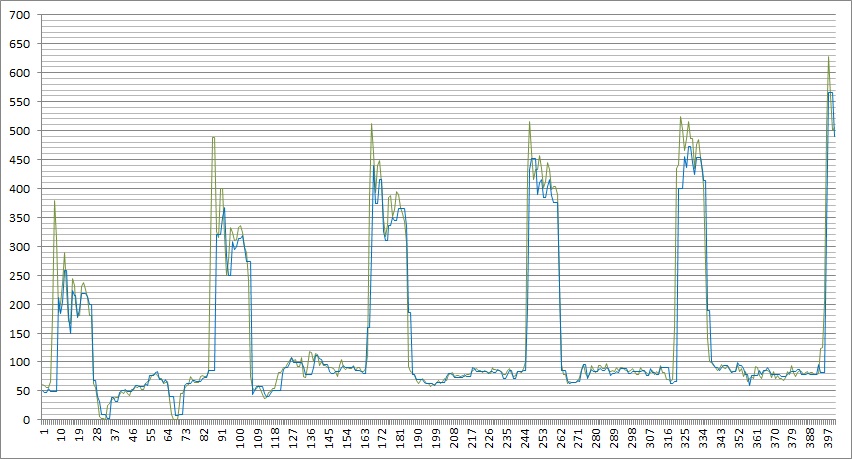
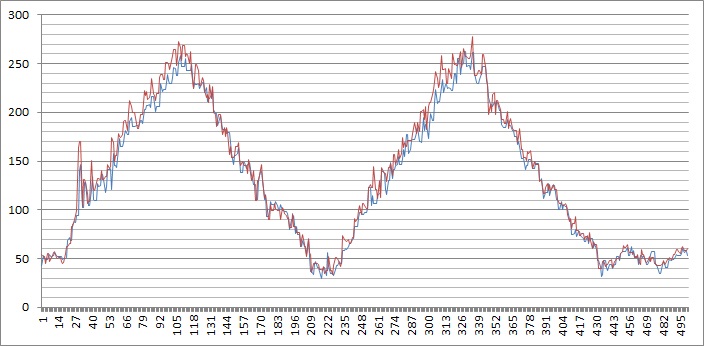 When looking at 15 second sprints, the delay seems negligible but the maximum power numbers are lower for the Pioneer:
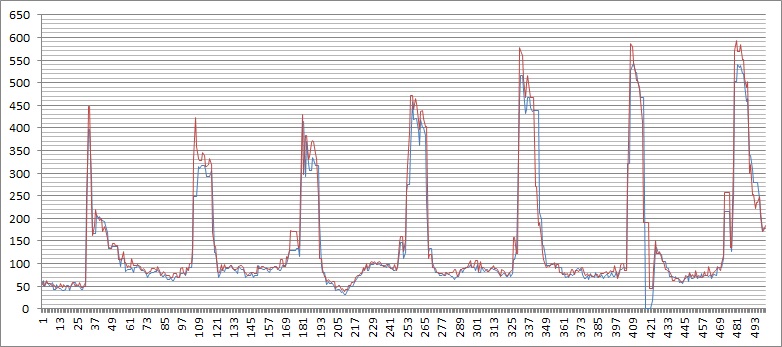
Next, comparison of Pioneer vs PowerTap P1. Again, no significant difference on a larger scale:
 Again, we see that Pioneer has some delay on the up-ramps. The P1 might even be a bit faster to respond than the Vector2, but it also seems to have a bit more spikes.
 Here, the first three sprints show that the P1 is more responsive than the Pioneer. Again, there is also a difference in maximum power values.
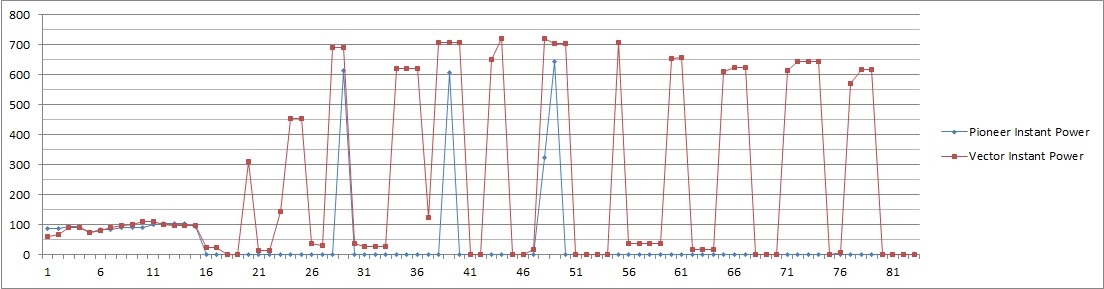
 A natural question now might be: What happens if someone does extremely short power bursts? It seems you can get away with 1 to 2 seconds of very brief bursts while the Pioneer is undecided whether that’s a burst or a noise spike. Although not noticable from the data alone: It seems that the Vector2 is slow to get down to zero and often didn’t go completely down as well, so, whereas the up-ramp of the Vector2 is more trustable than the Pioneer (which shows smaller than real power values because of it’s delay), the Vector2 may show inflated power values because of the delayed down step.
 (Section starting here added on August 11th)
Actually things are not that simple, for two reasons.
First, the ANT+ power meter protocol has to get power meters of fundamentally different designs like hub-based (where power is calculated from torque and wheel rpm) and crank-, spider- or pedal-based (where power is calculated from torque, cadence and, in the case of pedal-based meters, crank length) as well as head-units of different levels of sophistication (just displaying instant power, or being able to do calculations and recordings) under one roof. So the standard actucally includes different ways of communication. For example, in one such communication protocol, there is a data field for instant power, meant for simple displays, as well as accumulated power, from which you can either calculate average power (as the difference between current and last accumulated power; that’s I believe what the WASP does to calculate the average power data field) or correct accumulated statistics like TSS.
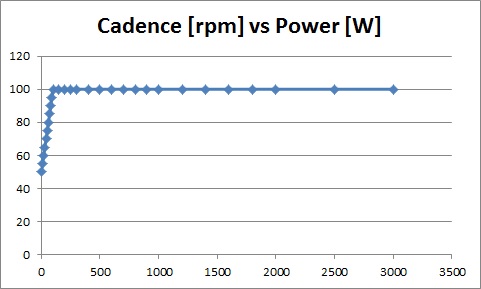
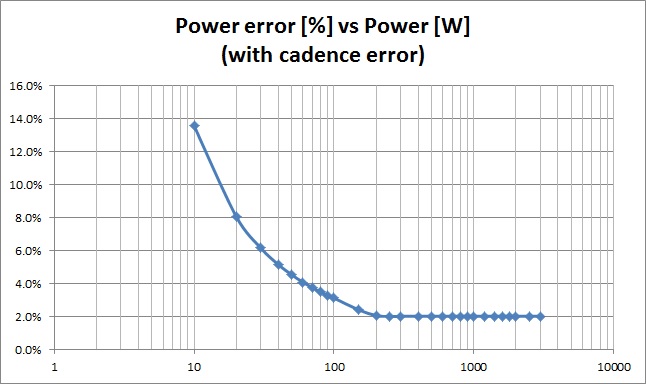
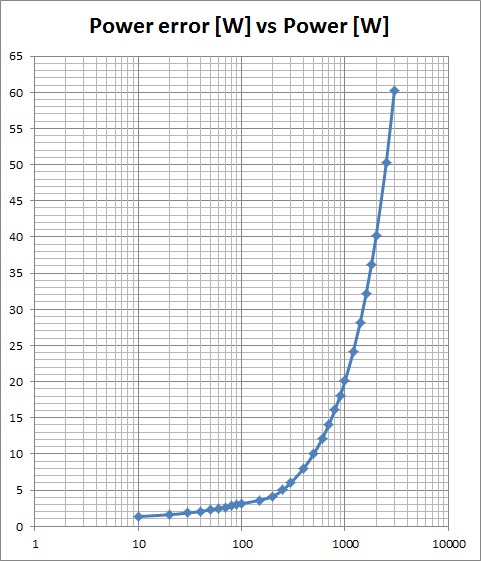
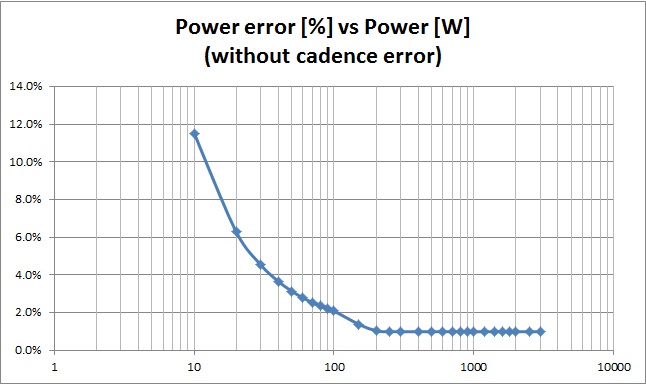
Second, current crank-, spider- and pedal-based meters all rely on a torque sensor and a basic physics formula that requires cadence to calculate power. (That’s also the issue with oval rings which kills the assumption of a constant cadence.) For these kinds of short bursts, even using accelerometers instead of a simple magnet that only triggers once for every crank rotation, it may be difficult to sense cadence accurately. (If they did, they’d all be able to provide correct data for oval rings, too.) So, these short bursts are likely outside of the not-published working conditions of these power meters. (Even Verve cycling which gives more information about working conditions than the other manufacturers doesn’t say how responsive their cadence data would be in such a condition.)
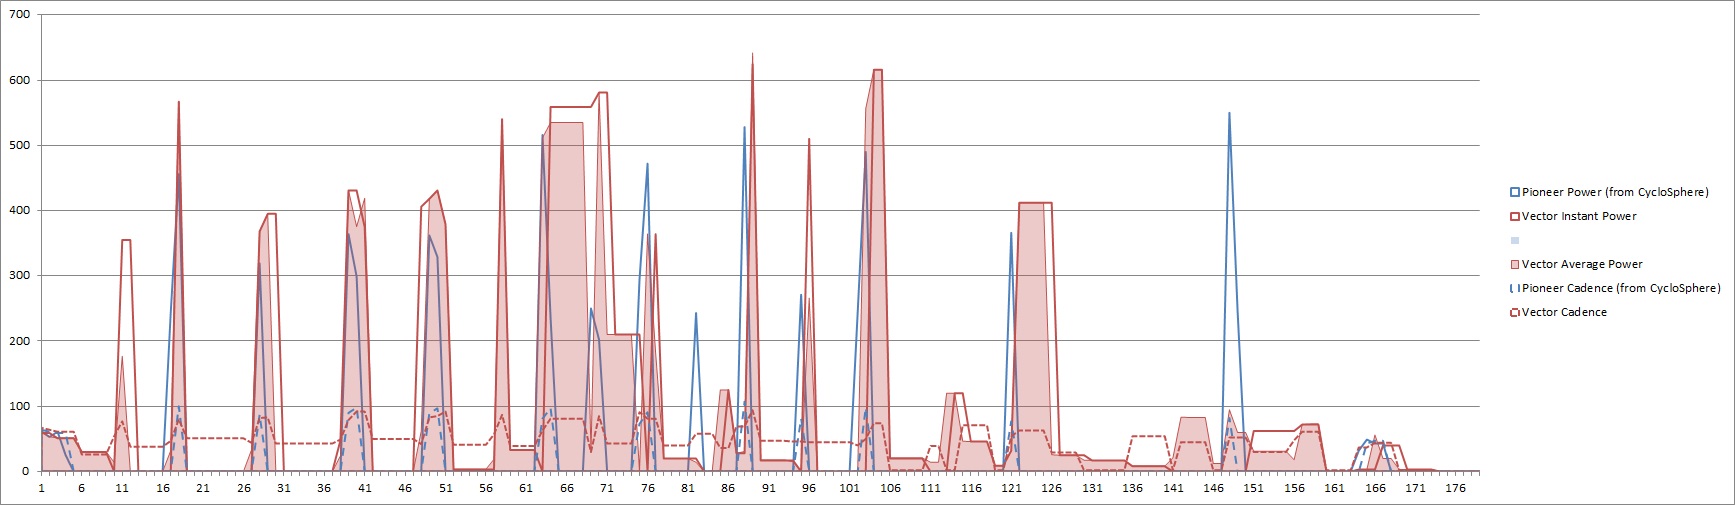
So, with this knowledge and including all relevant data, the above graph looks like this:
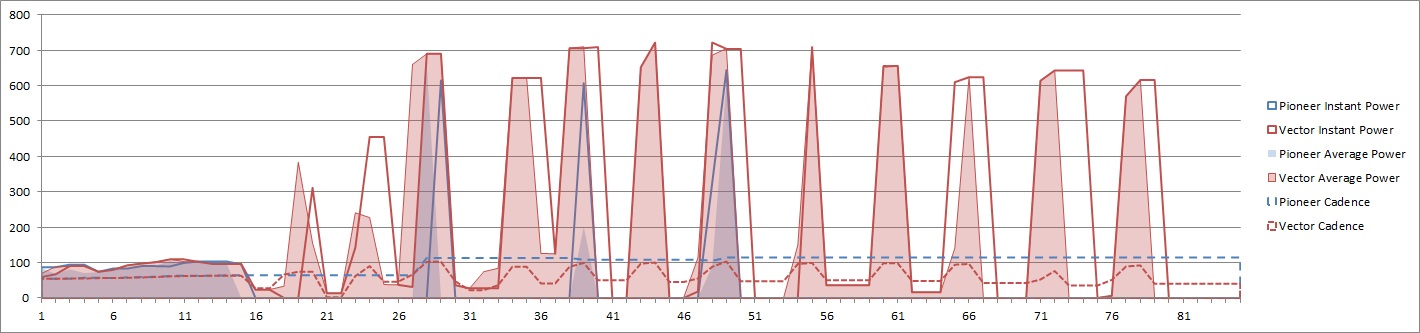 Although not visible from the data alone (if you trust me with this), I had stopped pedaling between the bursts, so, cadence data from both units are messed up, meaning that all the power data doesn’t look trustworthy to me (unless they are internally calculating with some other cadence data that they don’t send over ANT+). On the good side, Vector’s average power data seems to avoid the effect of sticking to high power values even after the burst has ended that I observed with their instant power data and on the Garmin Edge display. (Actually, they might have designed instant power this way so that you don’t miss data when briefly looking at your computer during a ride.)
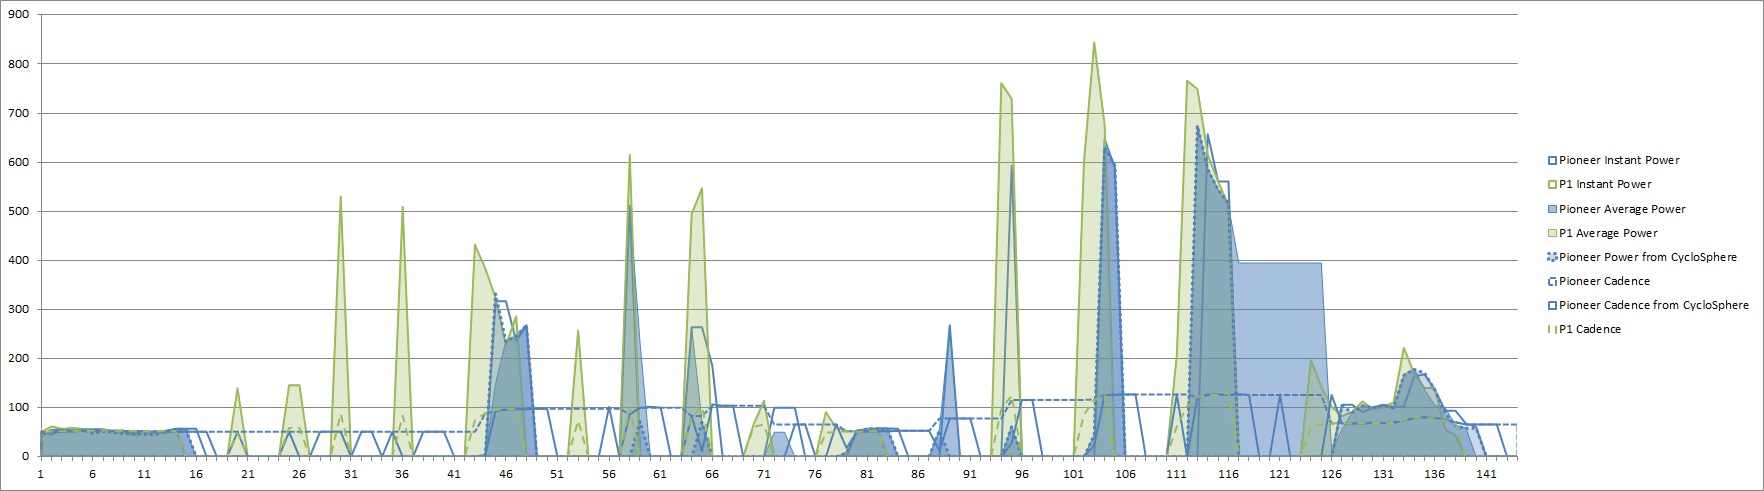
Now, when we compare the Pioneer in its proprietary pedaling-monitor mode, we get this:
 In pedaling-monitor mode, the Pioneer’s data cannot be recorded with the WASP, so I had to export from Cyclo-Sphere and convert the .fit file to .csv using GoldenCheetah, and manually align them as good as possible (note: a perfect alignment is not possible with devices that are not synchronized).
Now, the interesting thing here is that the Pioneer’s cadence data from Cyclo-Sphere looks much better than the one I got via ANT+, probably also contributing to power data that is closer to data from the Vector, although still lower, and there is not much of a delay compared with Vector.
Since I’d gotten myself already knee-deep into this, I also briefly swapped pedals and compared Pioneer in ANT+ mode with PowerTap’s P1.
 A few interesting observations: The P1 does not distinguish between instant and average power in the ANT+ protocol – I don’t actually know what the intention was for creating a protocol that allows separate numbers for them. The length of the bursts in the P1 data seems correct too, although I don’t have any data to back that up. On the other hand, the Pioneer seems to distinguish between cadence data available via Cyclo-Sphere and the “instant” cadence data from their ANT+ stream, possibly resulting in their Cyclo-Sphere power data to be more likely than the power data from their ANT+ stream.
Follow-up (August 15th):
Here is a set of Vector2 vs Power2Max comparison data. Slightly different setup, with data set taken on a roller and not the KICKR.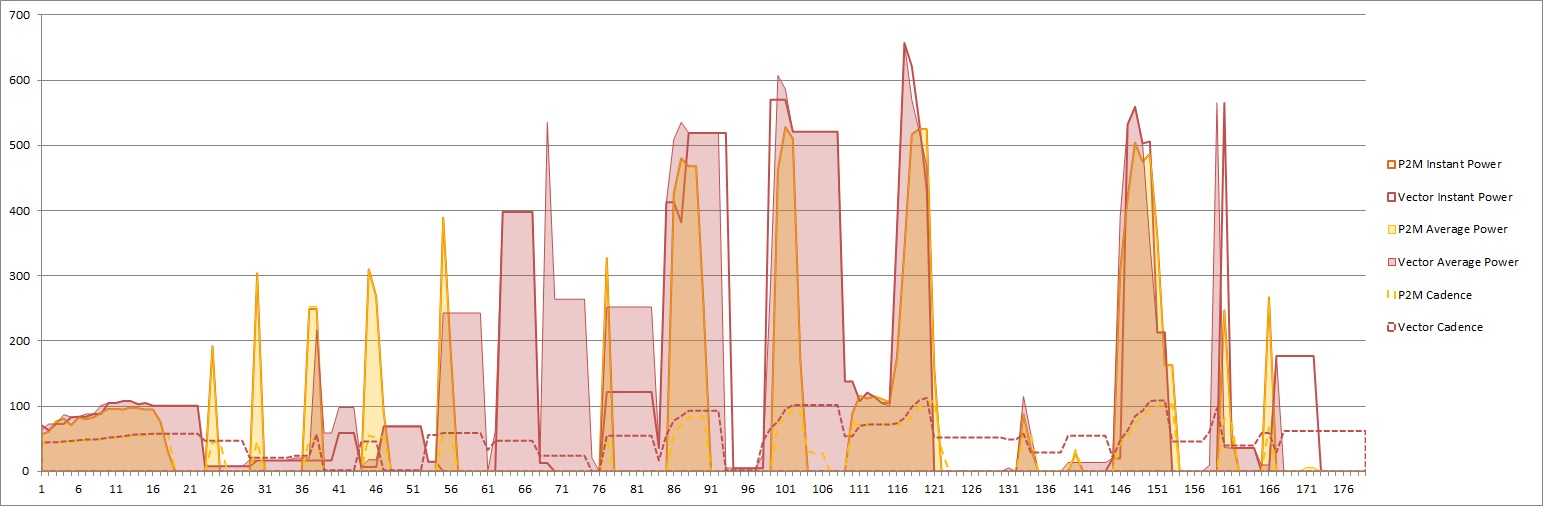 Observations: Genereally there is quite some difference between Vector and P2M. Between 21s and 60s I did some single crank rotations, which are much better picked up by the P2M. For two and more crank rotations, there is more agreement between the two in both start timing and power value, but vector seems to take longer to notice stops. P2M does not distinguish between instant and average power, while vector again has some larger differences between them.
Conclusion (revised on August 11th):
For normal riding, all three power meters seem pretty much good enough to me.
If anyone wants correct data for very short bursts, there is a fundamental limitation here: A crank- or pedal-based power meter depends on how exact it can measure cadence during such a brief burst, and even using accelerometers or mounting the cadence magnet to utilize polarization change for higher accuracy when sensing crank position.
So, my recommendation would be, to either try a hub-based power meter (although I admit I’ve never used one before and have no idea how they’d perform under such conditions) or go with the P1 (which seems to provide honest data, an impression that also somewhat aligns with their claim of using a large number of sensors (8) and enough computation power).
Personally, I highly value the realtime pedaling analysis data that the Pioneer power meter gives when combined with their head unit, which can be helpful for understanding and changing pedaling technique (whereas I personally found the advanced metrics of the Vector and Garmin’s visualization on the newer Edge units less useful, but that might be just myself). Therefore, as a total package, I’d still thing that the Pioneer will have the most impact on someone’s cycling performance although only in combination with their head unit and if you ride regularly indoors and are concerned about pedaling technique. (Yes, choices are never easy.) And, if you really need data from bursts using Pioneer, may be look at Cyclo-Sphere data and not their ANT+ stream.
A common way to reduce noise is to use something called a Kalman filter or to do at least some simple averaging; both necessarily delays the data output. It seems the Pioneer has been engineered more towards reducing erroneous spikes than the Vector2 and the P1, or it’s simply looking at a longer time window given that it was fundamentally designed as a pedaling monitor and averages less over crank rotation.
Other thoughts:
The general consensus in cycling data collection to use 1 second sampling seems old, considering how much communication bandwidth and memory capacity is nowadays available and that most power meters are actually sending at a higher rate. A higher rate could simplify simultaneous correct recording and undelayed display under all conditions including quick bursts.
But even at 1Hz, one should expect “instant power” to be instant possibly including spikes and “average power” to give correct data when accumulated over time. Power meter manufacturers should make clear what their specific conditions for accuracy are.
If I was to design a power meter from ground up, I’d possibly integrate a high resolution optical rotational encoder in the bottom bracket that together with accelerometers would enable giving exact rotational position and velocity, solving both oval ring issues as well as accuracy under bursts.
The comparison was also restriced by the WASP iOS app to be able to record only at 1Hz and not all the data that the power meters are sending, which would have allowed for more exact assessments of delay time. I was not able to check yet whether the WASP’s ANT+ to WIFI bridge functionality filters down to 1Hz (I need to sign their NDA first!) or whether it is a restriction of their iOS app. I was neither able to find a PC or Mac application for simply recording all ANT+ traffic.
The processing involved here is possibly somewhat comparable to high ISO noise reduction in digital cameras which reduces noise patterns but also image details. It might be good if power meter manufacturers made these noise reduction levels user-configurable as in higher-end digital cameras, empowering the user to choose the processing that is best for their usage.