Why look at pedaling data? Short term cycling performance – excluding long term training effects for now – is, in my understanding, about:
- Physiological efficiency in generating muscular force that works on the contact points – pedals, handlebar, saddle – with the least short term side effects like fatigue. As there are different pathways to generate muscular force – like burning fat or carbs – this includes finding the most efficient combination of fuels to sustain the targeted output over the targeted duration.
- Effectiveness of how you apply that muscular force and your body mass to turn the cranks. Tangential force on the cranks is effective and results in rotation but radial force does not. Pulling at the handlebar as a counterforce to increase your pressure on the pedals contributes to crank rotation but gripping the handlebar strongly does not. Body mass can be utilized rather statically as downward gravity or more dynamically as an inertial force to keep the cranks spinning at high cadence.
- Mechanical efficiency in turning the crank rotation into forward or uphill motion with the least amount of friction. Here, friction includes mechanical losses in the drivetrain, rolling resitance of the tyres and shifting air out of your way. If your ride goes downhill, you might include how to brake as little and keep as much momentum as possible.
The second item undeniably includes pedaling technique. But is it trainable? And, does pedaling data available on some power meters provide actionable information? It may not provide immediate answers but I think it provides a lot of food for thought.
There are a few different ways to graphically visualize pedaling and a few different ways to condense the characteristics into single numbers.
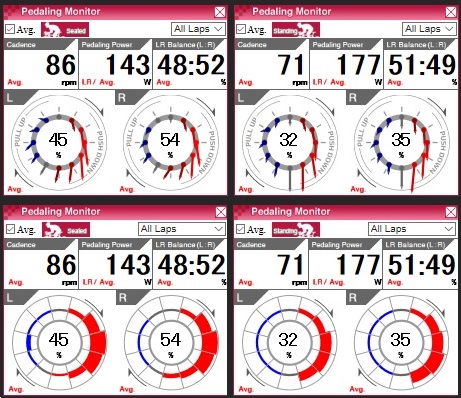 These are ride averages from a recent endurance climb on the Fuji-Subaru-line tollroad which leads halfway up on Mt.Fuji, Japan, and is the stage for an yearly hillclimb race with almost ten-thousand (!) participants. While the numbers – cadence, power, balance – should require no explanation, the graphs might be new to you. The left column shows average for seated pedaling while the right shows standing. The vectors in the graphs at the top show the direction and amount of the applied force at each of 12 crank angles whereas the botom graphs shows the amount of tangential force on the cranks, useful for judging for example where you had your peak (here it’s around 3 o’clock for sitting and 4 o’clock for standing) or where the forward rotational force (red) turned into counteracting resistance (blue) . There is also a left-right unbalance in the location of the peak when standing (later on the right). The percentage number in the center of the graphs is what pioneer calls “pedaling efficiency” defined as the ratio between tangential force and the sum of tangential and rotational force averaged over whole crank rotations. It would be 100% if the force vectors are perfectly tangential but does not require the amount of the force to be constant over the whole rotation.
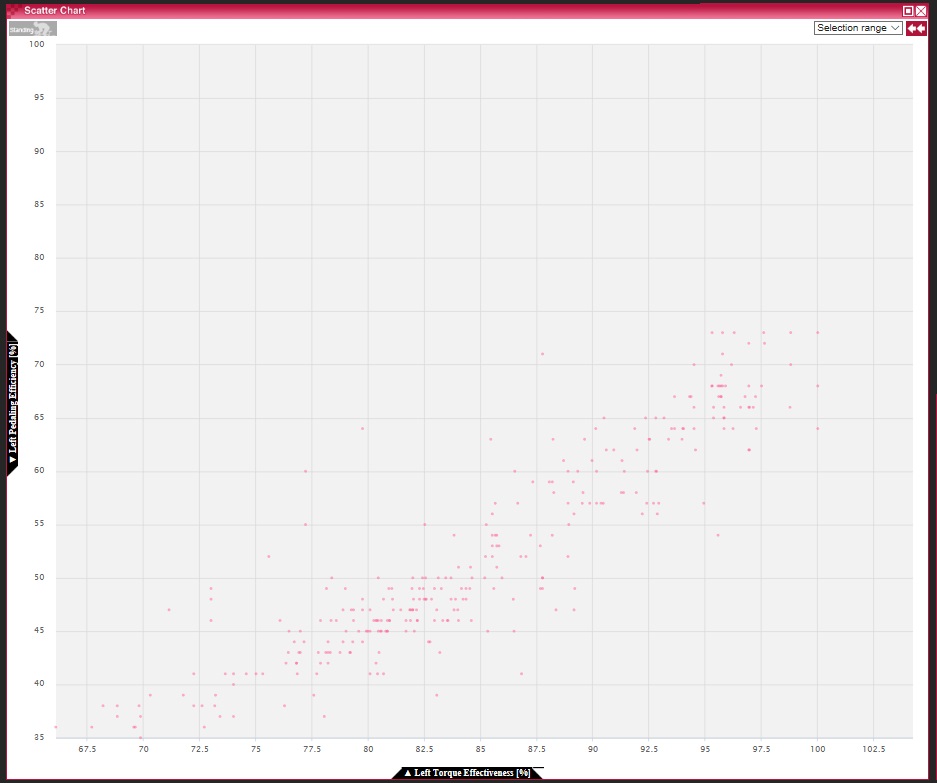
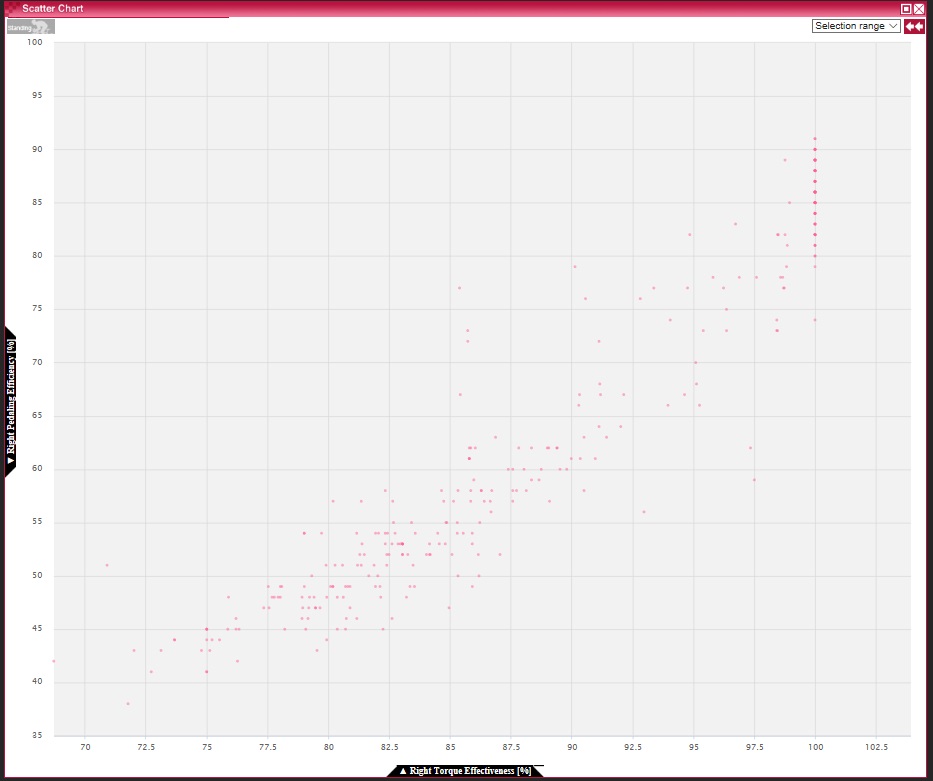
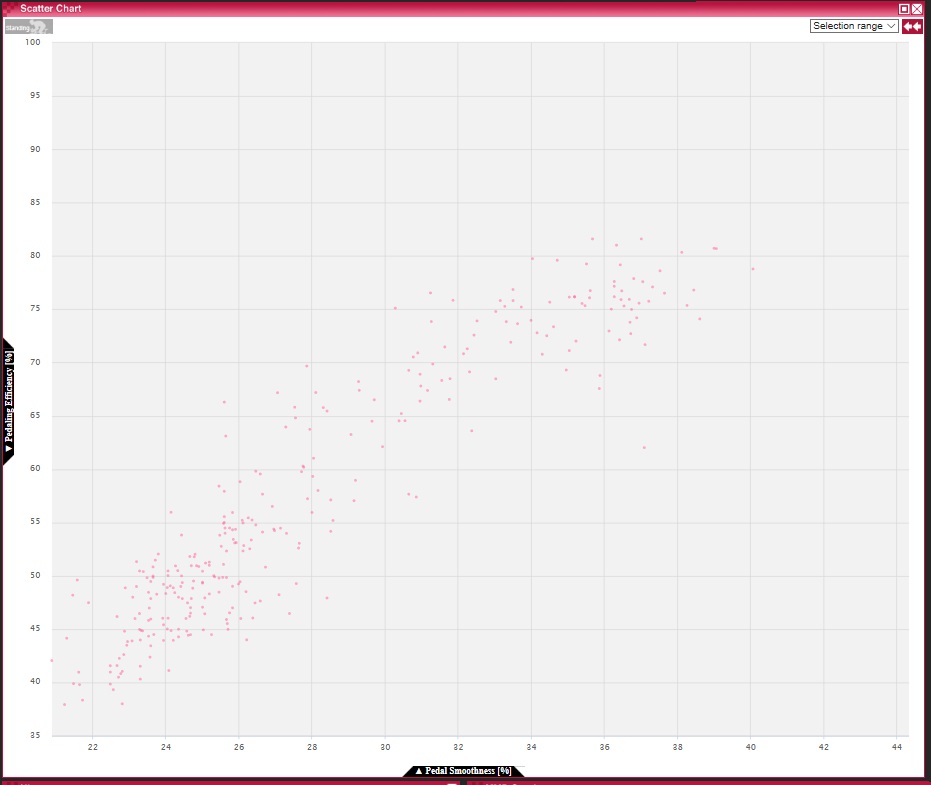
Out of the advanced pedaling metrices available on cycling computers, this one makes most sense to me as a quantification of the effectiveness of using body weight and muscular force to turn the cranks. Pedaling smoothness defined as the ratio of maximum tangential power to average tangential power – which is a crude way to express smoothness by the way – is probably pointless as it ignores that human biomechanics makes downward pushing easier than pulling up. Torque effectiveness defined as the ratio of forward power against total power is slightly more meaningful but often reaches 100% at which point further improvements cannot be quantified. My only criticism with Pioneer’s pedaling efficiency is that it’s actually not measuring efficiency but effectiveness and should therefore be called “pedaling effectiveness” and not “pedaling efficiency”.
That said, those three metrices are mostly correlated as visible in the following graphs:
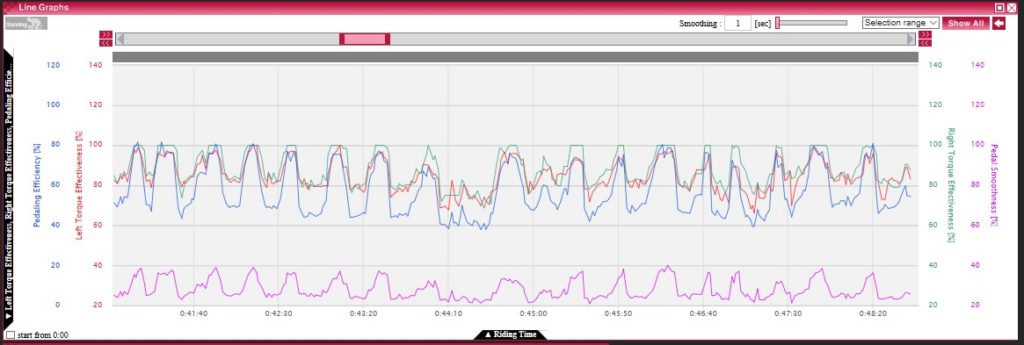
Getting back to the Mt.Fuji ride, the complete ride was about 2 hours uphill at a comfortable pace of between 3.0 and 3.5W/kg, with stops at a traffic light, the toll booth, then stopping to add a long sleeved shirt after gaining about 1000m in altitude and a brief rest before the final incline. The light green section is what the power meter noticed to be standing pedaling. There is usually more detail that becomes apparent only if you zoom.

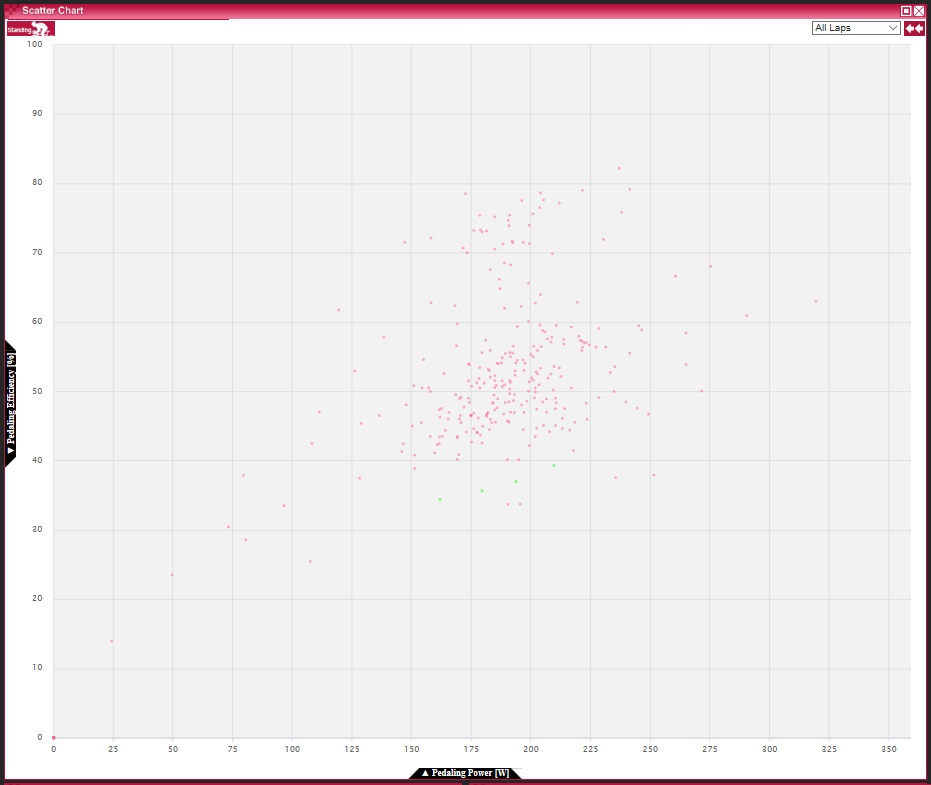
The following scatter plot of pedaling efficiency against power shows where most of my pedaling was: I rode mainly between 150W and 225W in power – a comfortable endurance pace centered around 75% FTP – and 40% to 60% in pedaling efficiency. What we learn is that some points including standing pedaling (in green) are below 40% and some go as high as 80%.
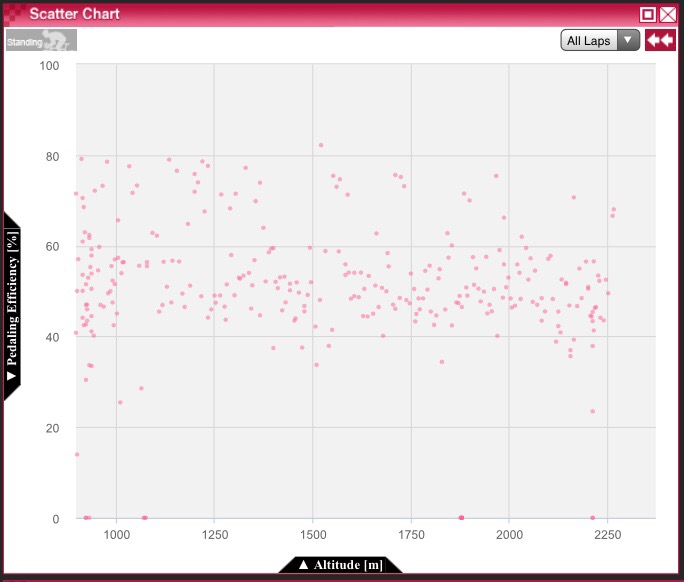
For this ride which went practically uphill all the time, the following efficiency vs altitude scatterplot shows how efficiency changed over time. We see a decrease in efficiency but which is probably small enough to be negligible.
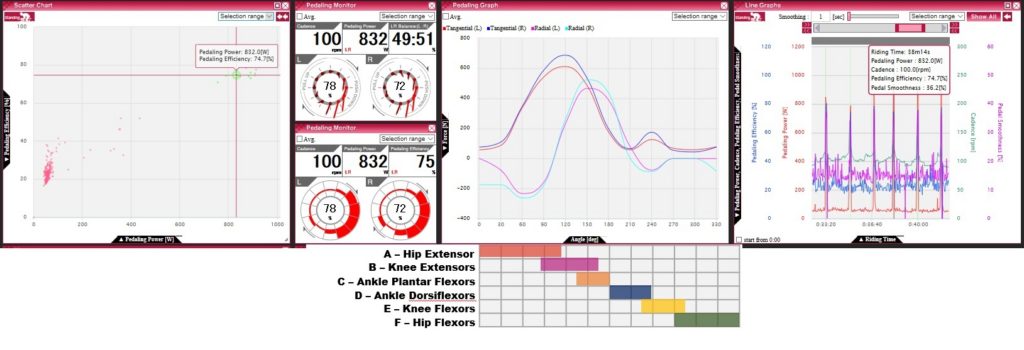
If we drill down into details, you will notice that an interesting characteristic of my pedaling is that I alternate in about 20 second cycles (almost unconsciously) between downward-focused pedaling at around 50% efficiency and a more circular pedaling style at around 80% efficiency.


I believe I’ve had this custom for quite a long time. I have no information about how common such pedaling is. It’s somewhat comparable to alternating between sitting and standing to switch muscles used and avoid fatiguing the same ones. It doesn’t have to be a bad thing, but I seeing this fact, I wonder whether to not care about this or attempt finding a middle path between the two styles or increase the time spend in one or the other for example to increase overall efficiency or to reduce overworking my calves which tend to cramp in long rides. I’ve added a rough visualization (below the tangential/radial pedaling force vs crank angle graph) showing which muscles are used at each crank angle in the hope of noticing something but couldn’t make anything of it yet. I probably need to record activation of specific muscles using EMG sync’ed to crank angle to identify how I am using which muscles in either of these pedaling styles. Alternatively I could use SmO2 sensors (which I have already and which I needn’t sync with crank angle) to quantify muscle from O2 levels. We’ll see if I can get the data collected sometime during the winter.
Another observation would be that the slight imbalance in power towards right leg also coincides with higher efficiency on the right, and also that left and right look similar for downward pedaling on the force vs crank angle diagram but there is a significant imbalance for circular pedaling in tangential force between 6 and 12 o’clock and around 3, 6 and 11 o’clock for radial force.
For standing pedaling at similar power, the efficiency is significantly lower at around 40%, with peaks of tangential power occuring later at around 4 and 5 o’clock as more body mass rests on the legs and is used to push the pedals downwards. It’s somewhat interesting that there is less left-right imbalance in power but there is a significant difference in radial force at 6 o’clock, where it seems that I am less able to pull my body weight off my left pedals. Reasons for this could be that I am less dexterous with my left leg or that I am actually using more of my body weight when pushing down the left pedals to cover less muscular force.

So much from the Mt.Fuji data set. To complete the picture with high and low power data, the following data is from an indoor ride.
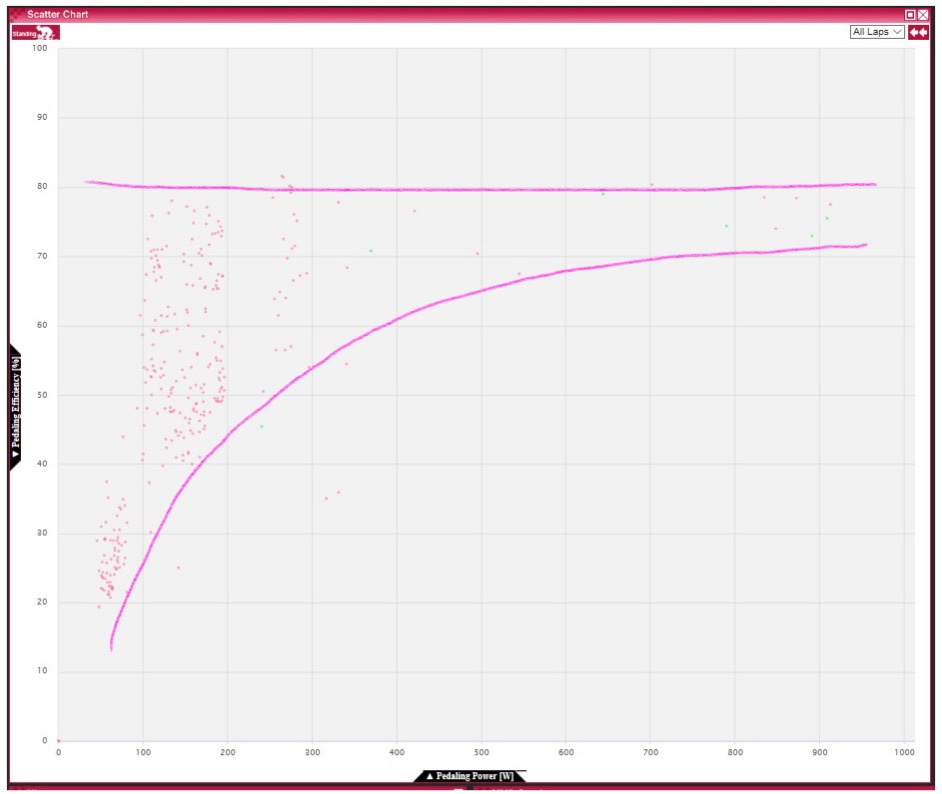
The efficiency vs power scatter plot now covers the whole range of my cycling power up to about 900W or 16W/kg and we see more easily that higher power generally conincides with higher efficiency and that I saturate at about 80% (for all wattages).
First, let’s look at a high power sample at about 400% FTP or 14W/kg. Compared with the previous sample of standing pedaling, efficiency is much higher at above 70% compared with about 40%. Left and right leg have to counteract to put down this much force and which naturally leads to more circular pedaling.
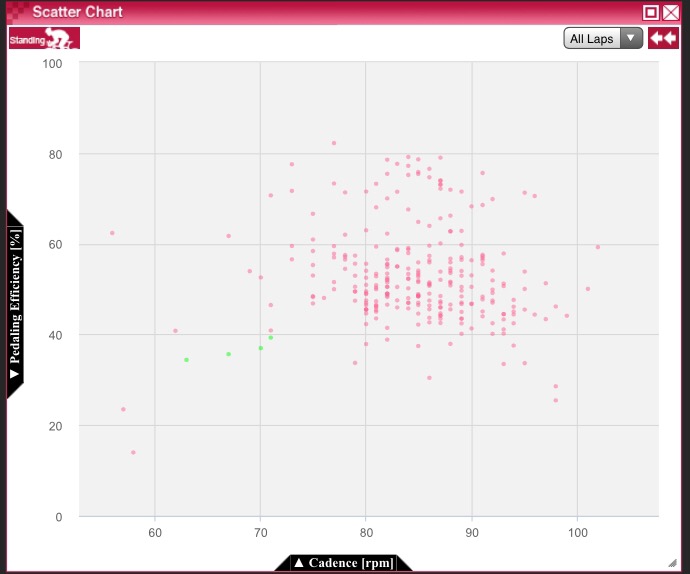
Cadence is lower than my usual 80 to 90rpm when sitting and similar to the previous sample at FTP. Does this affect efficiency? For sitting, efficiency does not seem to be affected by cadence.
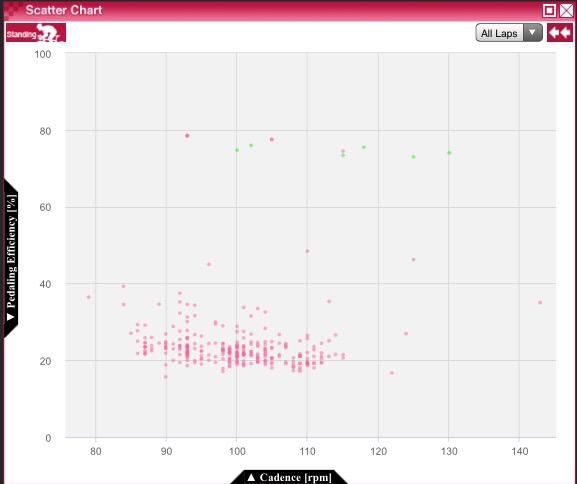
How about standing though? There I see two extremes – low efficiency at low power/cadence and high efficiency at high power/cadence but nothing in between. This might or might not indicate potential for improvement and makes me realize that I haven’t done standing high cadence drills for quite some time.
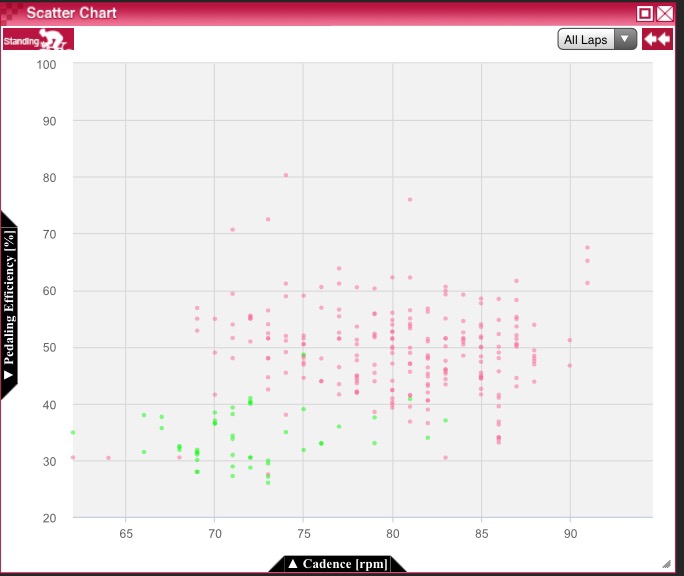
Also note that I had about 2.5kgs of wind jackets etc in my waist bag which made me aware of up-down motion of my waist. I consciously attempted to avoid up-down bouncing of that bag and felt that the overall impact on pedaling was positive. I probably should compare pedaling data with and without that weight to find out.
Finally a low power example at about 50% FTP. It is quite difficult to perfect motion at such low power – not only for myself but also for others. But that shouldn’t mean that it’s a necessity and I wonder if that can be overcome with better body awareness and control.

All the above was mostly on the hoods, and a complete analysis should look at pedaling in the drops and in aero bars separately from this. I actually noticed an imbalance in the range of motion of my legs when riding my TT bike, which led me to choose short 150mm cranks to stay inside the range of my left legs. (Unluckily there is no 150mm version of the Pioneer power meter.) I learned afterwards that range of motion can be increased by training, so it would be interesting to see if that would not just benefit aero position but also resolve some part of the imbalance in left and right efficiency on a road bike.
Thanks for reading. Could have missed something or misinterpreted, so would appreciate any thoughts.